INP — Interaction to Next Paint
INP (Interaction to Next Paint) measures how quickly your page responds visually to user interactions — clicks, taps, and keypresses — across the entire…
5 min read · updated 2026-08-14
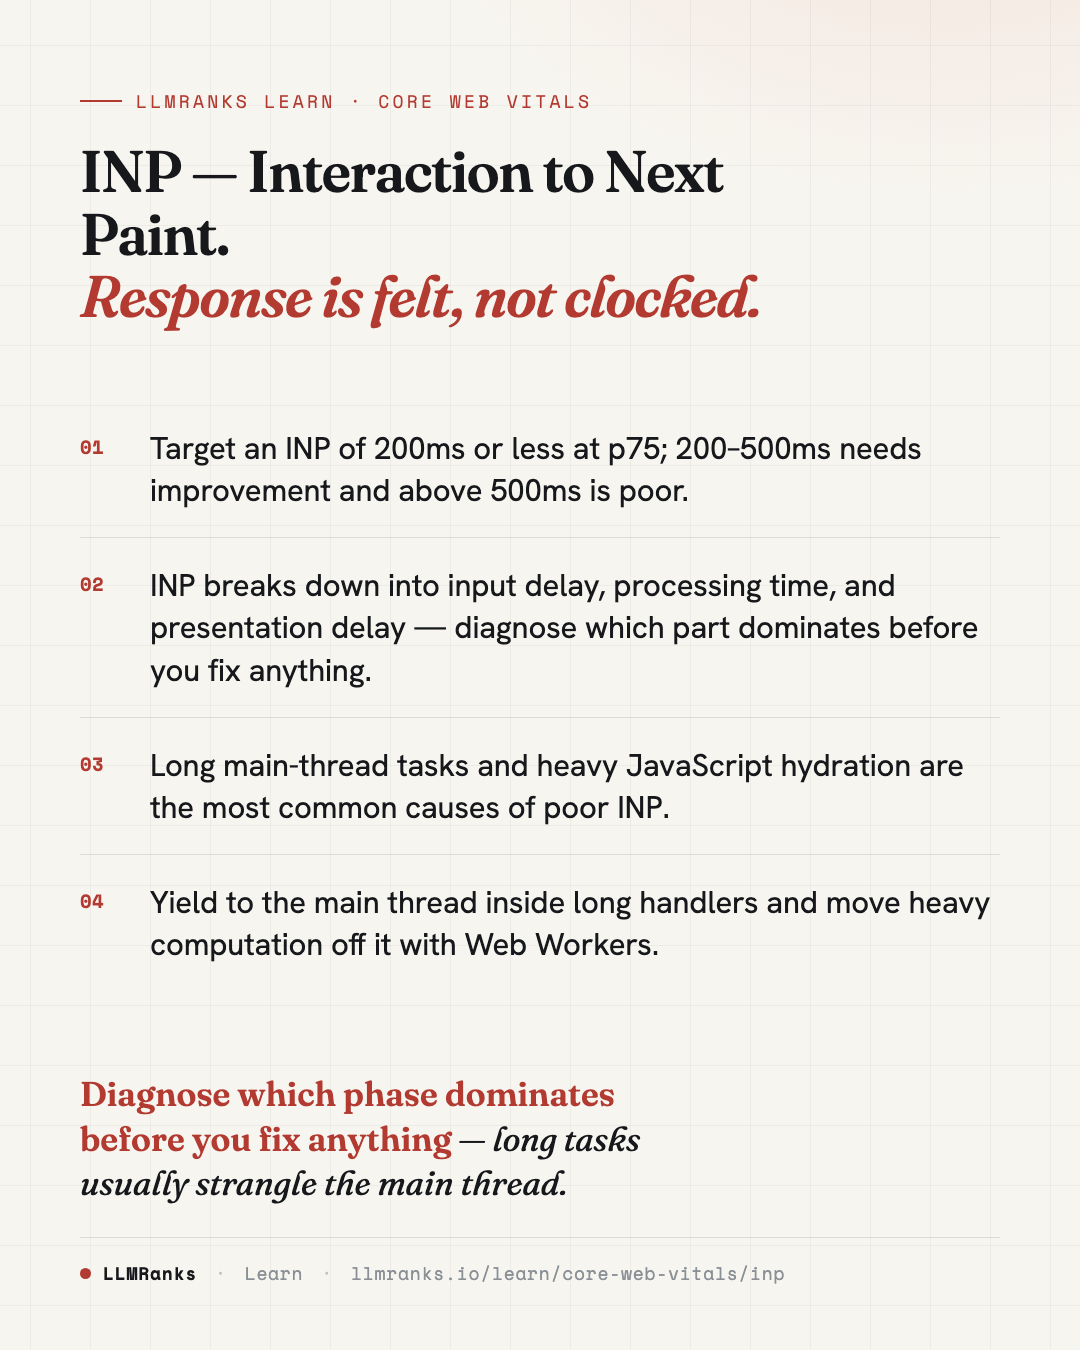
INP (Interaction to Next Paint) measures how quickly your page responds visually to user interactions — clicks, taps, and keypresses — across the entire time someone spends on the page. It reports the worst (or near-worst) interaction latency, timed from the moment input starts to the next paint that shows a visual response. A good INP is 200ms or less at the 75th percentile; anything over 500ms is poor. Because it tracks every interaction rather than just the first, INP is meaningfully harder to fix than the metric it replaced.
What INP measures
INP watches every interaction over the page's lifetime — clicks, taps, keypresses — and reports the worst one (or a near-worst value after the 50th interaction) as the page's score. It measures the latency from when the input event starts to the next paint that reflects the visual response, so it captures how "stuck" your interface feels, not just whether it eventually responds.
The scoring thresholds at the 75th percentile are:
| Rating | INP at p75 |
|---|---|
| Good | ≤ 200ms |
| Needs improvement | 200–500ms |
| Poor | > 500ms |
INP is one of the Core Web Vitals, alongside LCP and CLS.
How INP breaks down
Every measured interaction splits into three parts, and knowing which one dominates tells you where to look:
- Input delay — the time before your event handler can run, usually because the main thread is busy with other work.
- Processing time — how long the handler itself takes to execute.
- Presentation delay — the time to paint after the handler finishes.
INP is significantly harder to address than FID was. FID only measured the first interaction on a page. INP includes scroll-handler jank, dropdown menus, modal opens — anywhere your app feels unresponsive during use.
Common causes
Poor INP almost always traces back to work blocking the main thread when the user tries to interact.
- Long tasks on the main thread (over 50ms): React reconciliation, large state updates, and synchronous layout thrashing all stall input.
- Hydration cost: full-page hydration of a server-rendered React or Vue app blocks all input until it completes. A 500KB JS bundle on a mid-tier Android device can hydrate in 2–4 seconds.
- Third-party scripts: tag manager containers, A/B testing tools, chat widgets, and session replay scripts add execution weight. The median GTM container still injects 8–15 tags that execute on first interaction.
- Synchronous event handlers doing heavy work: filtering large arrays on
keyupor running expensiveuseMemorecomputes inside a handler. requestAnimationFramecallbacks that block the paint after an interaction.- Forced synchronous layout: reading
offsetWidthright after writing styles inside a handler.
Fixes that move the needle
Keep the main thread free
- Yield to the main thread inside long-running handlers.
scheduler.yield()(Chrome 129+) is the preferred approach; fallbacks includeawait new Promise(r => setTimeout(r, 0))orMessageChannel-based yielding. - Wrap non-urgent state updates in
startTransition(React 18+) to defer them to a lower priority. - Use
requestIdleCallbackfor analytics, logging, and prefetching — but never inside an interaction handler. - Move heavy computation such as filtering, sorting, parsing, and crypto to Web Workers. Comlink makes this ergonomic.
- Debounce or throttle expensive input work: a 150–300ms debounce on search inputs, and throttle scroll handlers to 16ms or mark them
passive: true. - Audit
setTimeoutandsetIntervalfiring more often than every 200ms — they create constant main-thread pressure. - Replace large client-side filtering with server-side or edge-cached endpoints.
Reduce or avoid hydration
Hydration is one of the biggest INP costs, so cutting it pays off directly:
| Approach | How it helps |
|---|---|
| Astro islands | Ships ~0KB JS by default; hydrates only marked components |
| Qwik | Uses resumability instead of hydration |
| React Server Components (Next.js App Router) | Non-interactive components ship zero client JS |
| Svelte 5 with runes | Smaller hydration cost than React by 3–5x |
If you can't avoid hydration, use selective or progressive hydration: hydrate above-the-fold content first and defer below-the-fold components to an IntersectionObserver.
Tame third-party scripts
Lazy-load third-party scripts to first interaction or idle. Partytown moves them into a Web Worker, and next/script with strategy="lazyOnload" or "worker" works similarly. For more on this, see Third-Party Script Management.
Diagnosing real-user INP
Lab tools show you the shape of the problem, but INP is a field metric — you need data from real users to find the interactions that actually hurt.
- Use
PerformanceObserverwithtype: 'event'anddurationThreshold: 16to capture slow events from real users. - For each slow event, capture the
event.targetselector,event.type, andevent.duration, plus script attribution from theLongAnimationFrameAPI (Chrome 123+), which reports the script URL and function name. - Aggregate by selector and event type to surface the worst handlers so you know exactly where to optimize.
For the lab-side metrics that help explain main-thread behavior, see TTFB, FCP & TBT Lab Metrics.
What to do
- Measure your INP at p75 from real users and confirm whether you're above the 200ms good threshold.
- Break offending interactions into input delay, processing time, and presentation delay to find the dominant cost.
- Audit hydration — if a large JS bundle blocks input on load, adopt islands, server components, or progressive hydration.
- Add yielding (
scheduler.yield()or a fallback) inside any long-running interaction handler. - Move heavy computation to Web Workers and debounce or throttle input-driven work.
- Lazy-load third-party scripts to idle or first interaction, and consider running them in a worker.
- Set up field monitoring with
PerformanceObserverandLongAnimationFrameattribution, then aggregate by selector and event type to keep fixing the worst handlers over time.
save this card
 Download card
1080×1350 · post it anywhere
put it to work
See how ChatGPT, Gemini and Google AI actually talk about your brand.