TTFB, FCP & TBT Lab Metrics
Lab metrics like TTFB, FCP, and TBT don't appear in field data as direct ranking inputs, but they're essential for diagnosing why your page is slow. Time to…
5 min read · updated 2026-08-15
Lab metrics like TTFB, FCP, and TBT don't appear in field data as direct ranking inputs, but they're essential for diagnosing why your page is slow. Time to First Byte (TTFB) measures how long it takes your server to send the first byte of a response — a good target is a p75 under 800ms, dropping to under 200ms for cached HTML served from the edge. Because TTFB is a major contributor to LCP, fixing a slow server response is often the fastest way to unlock a better score. This page explains what each lab metric measures and how to act on it.
Why lab metrics matter
Lab metrics are measured in a controlled test environment rather than collected from real users in the field. They don't feed directly into ranking the way field-based Core Web Vitals do. Their value is diagnostic: they help you isolate the specific stage of page load that's holding back your visible performance.
That distinction matters. Field data tells you that a page is slow; lab metrics tell you where the slowness lives — in the server response, in the first paint, or in JavaScript execution. Use them together, and treat the lab numbers as a way to reason about the causes behind your field scores.
Time to First Byte (TTFB)
TTFB is the time it takes for your server to respond with the first byte after a request. It captures everything that happens before the browser can even begin rendering: DNS lookup, connection setup, server processing, and network transit.
Targets to aim for:
| Scenario | Target |
|---|---|
| Overall p75 | < 800ms (good) |
| Cached HTML served from edge | < 200ms |
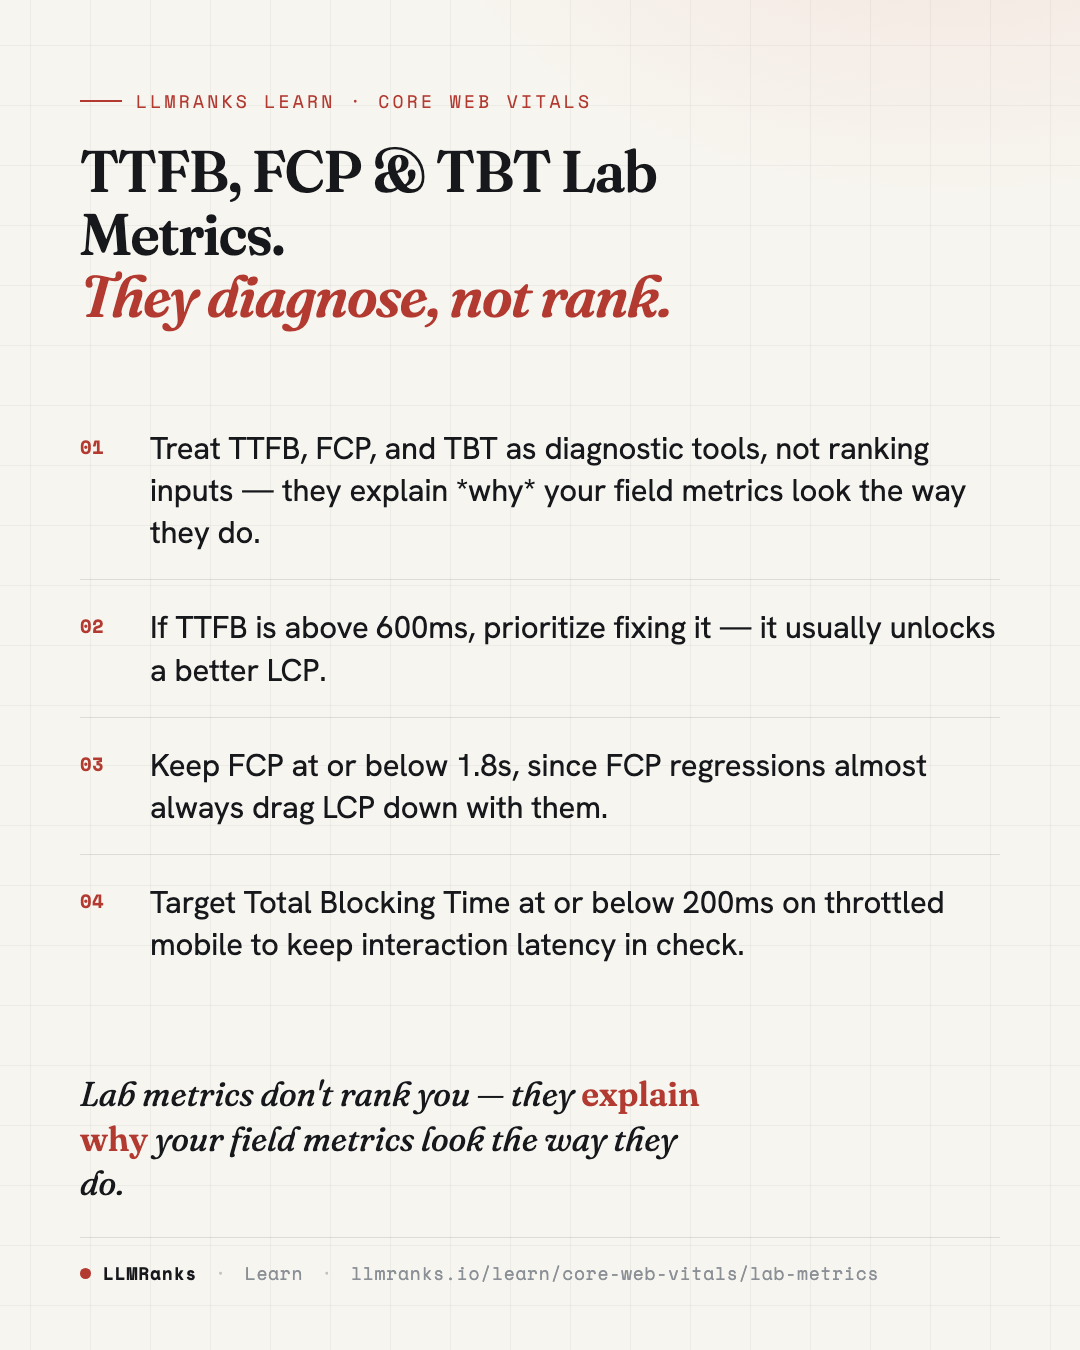
TTFB is a major contributor to LCP, because every millisecond spent waiting for the first byte delays everything that follows. A practical rule of thumb: if your TTFB is above 600ms, fixing it usually unlocks a better LCP. That makes TTFB one of the highest-leverage things to address when a page feels slow.
Because TTFB is dominated by server response and delivery, your infrastructure choices carry most of the weight here — see Hosting & CDN for SEO for how edge caching and server location factor in.
First Contentful Paint (FCP)
FCP measures the time until any text or image first paints on screen. It's the moment the page stops being blank and the user sees something. A good FCP is 1.8s or less.
FCP has a fixed relationship with LCP: FCP happening after LCP is impossible by definition, since the largest contentful paint can't occur before the first contentful paint. In practice this means FCP regressions almost always cause LCP regressions. If your first paint gets slower, your largest paint follows.
Because TTFB sits upstream of FCP, and FCP sits upstream of LCP, these three metrics form a chain. A slow first byte pushes out first paint, which pushes out largest paint. Diagnosing the earliest link in that chain is usually the most efficient fix.
Total Blocking Time (TBT)
TBT is a lab proxy for INP. It's the sum of the blocking portion of long tasks — specifically, the time beyond 50ms for each long task — during page load. A good TBT is 200ms or less, measured on a throttled mid-range mobile device.
High TBT predicts high INP, but the two don't correlate perfectly. The key difference:
- TBT is a load-only measurement — it captures main-thread blocking during the initial page load.
- INP is a lifetime measurement — it reflects interaction responsiveness across the entire time a user spends on the page.
So a page can post a decent TBT and still deliver poor INP if interactions later in the session trigger heavy work. Still, TBT is the best lab signal you have for interaction responsiveness, and it's worth watching. Most TBT problems trace back to JavaScript execution, so Third-Party Script Management is often where the fix lives.
Speed Index
Speed Index measures how quickly the visible content of a page fills in over time — its visual completeness. It's most useful for hero-heavy pages where a lot of the above-the-fold area is imagery.
In practice, Speed Index is less actionable than LCP. When you fix LCP, Speed Index usually follows, so there's rarely a reason to optimize it in isolation. Treat it as a supporting signal rather than a primary target.
How the metrics relate
Think of these lab metrics as stages in a sequence rather than independent numbers:
- TTFB — how long until the server responds.
- FCP — how long until the first pixel of content appears.
- TBT — how much the main thread is blocked during load.
- Speed Index — how quickly the visible page fills in.
Because they chain together, the earliest metric in the chain often carries the most leverage. A poor TTFB propagates forward into FCP and LCP, so fixing the server response frequently improves several metrics at once. For the bigger picture on how — and whether — these speed signals influence search, see Do Core Web Vitals Affect Rankings?.
What to do
- Measure TTFB first. If it's above 600ms, treat it as your top priority — fixing it usually unlocks LCP.
- Push toward the targets. Aim for TTFB p75 under 800ms overall, and under 200ms for cached HTML served from the edge.
- Cache and serve from the edge where you can, since server response and delivery dominate TTFB. Review your hosting and CDN setup.
- Keep FCP at or below 1.8s. Because FCP regressions almost always cause LCP regressions, watch the two together.
- Track TBT on throttled mobile and keep it at 200ms or less. Use it as your lab proxy for INP, but remember it only covers page load — verify real interaction responsiveness with field INP.
- Reduce main-thread blocking by auditing third-party scripts and heavy JavaScript.
- Don't chase Speed Index directly. Fix LCP and it usually follows.
For how these fit into the broader field-based signals, start with Core Web Vitals.
save this card
 Download card
1080×1350 · post it anywhere
put it to work
See how ChatGPT, Gemini and Google AI actually talk about your brand.